XB-IMG-133204
Xenbase Image ID: 133204

|
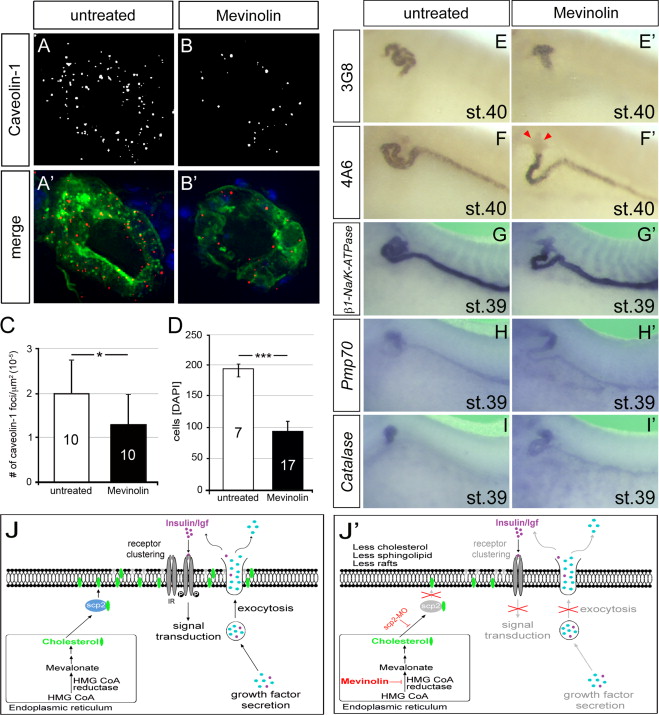
Fig. 5. Proximal Tubule Phenotype upon Inhibition of Cholesterol Synthesis. (AâB׳) Immunofluorescence analysis of untreated controls and embryos treated with 125 μM Mevinolin at stage 40 using anti-Caveolin-1 (red) antibody and ECL (green) with the gray-scale image showing Caveolin-1 staining alone and the color panels showing merged images. DAPI (blue) was used to visualize nuclei. (C) Quantification of the number of Caveolin-1-positive foci identified in (A,B). The number of embryos analyzed is indicated in the individual bars. Data were analyzed by Student׳s t-Test and asterisk represent a significance of p<0.05. (D) Bar diagram of the number of proximal tubular cells in untreated controls and Mevinolin-treated embryos at stages 40. The number of embryos analyzed is indicated in the individual bars. Data were analyzed by Student׳s t-Test and the three asterisks indicate a significance of p<0.001. (EâI׳) Untreated controls and Mevinolin-treated embryos were processed for 3G8 and 4A6 immunohistochemistry at stage 40 (EâF׳) or whole mount in situ hybridization with β1-Na/K ATPase (G,G׳), Pmp70 (H,H׳) and Catalase (I,I׳) at stage 39. (J,J׳) Model for the role of lipid rafts in proximal tubule elongation in the wild-type situation (J) or in the absence of scp2 or upon treatment with Mevinolin (J׳). See discussion for details. Image published in: Cerqueira DM et al. (2014) Copyright © 2014. Image reproduced with permission of the Publisher, Elsevier B. V.
Image source: Published Larger Image Printer Friendly View |
