XB-IMG-133367
Xenbase Image ID: 133367

|
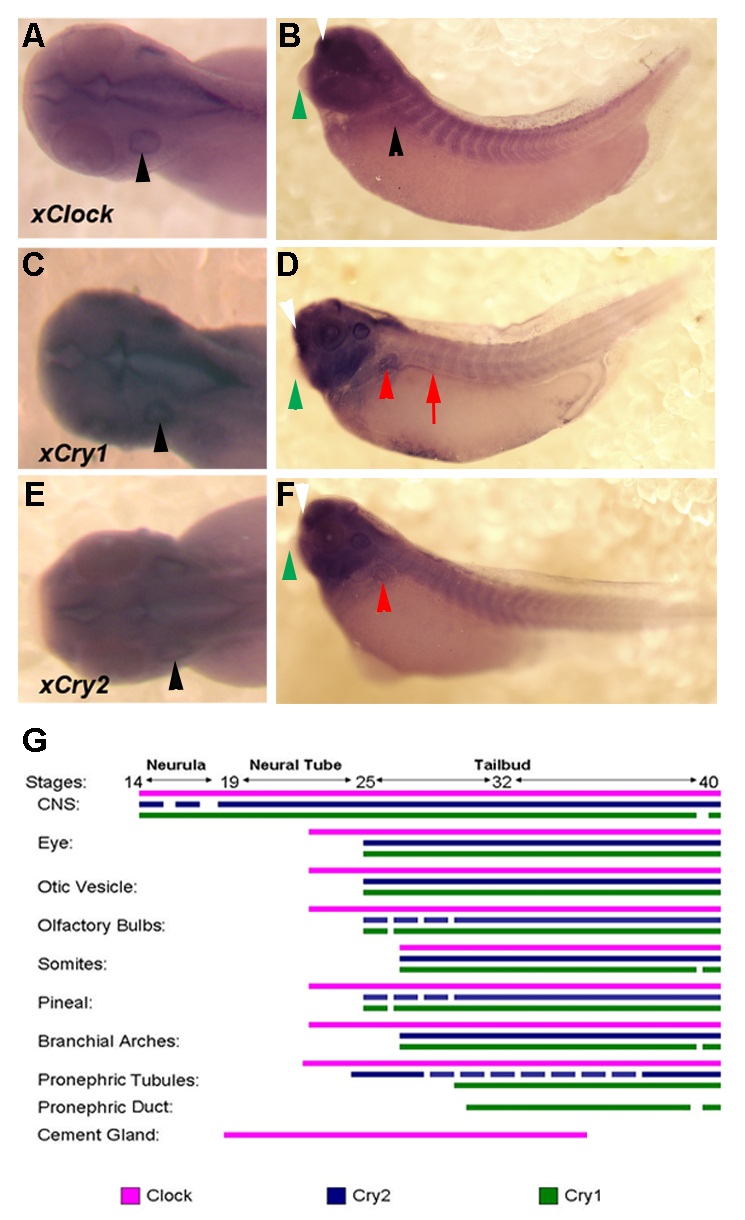
Figure S2. A summary of the developmental expression of xClock, xCry1, and xCry2. In situ hybridization was performed on stage 35â38 embryos. Dorsal view of the head and lateral views of the entire embryo are shown for xClock (A,B), xCry1 (C,D), and xCry2 (E,F). Black arrowheads highlight the otic vesicle while white arrows show expression in the olfactory bulb. Red arrowheads highlight the pronephric tubules while red arrows show the pronephric duct if visible. The cement gland is indicated by a green arrowhead. A developmental time series is provided (G) below the images to show the earliest we were able to detect each gene's expression in various embryonic organs and tissues. Image published in: Curran KL et al. (2014) Image reproduced on Xenbase with permission of the publisher and the copyright holder. Creative Commons Attribution license
Image source: Published Larger Image Printer Friendly View |
