XB-IMG-152317
Xenbase Image ID: 152317

|
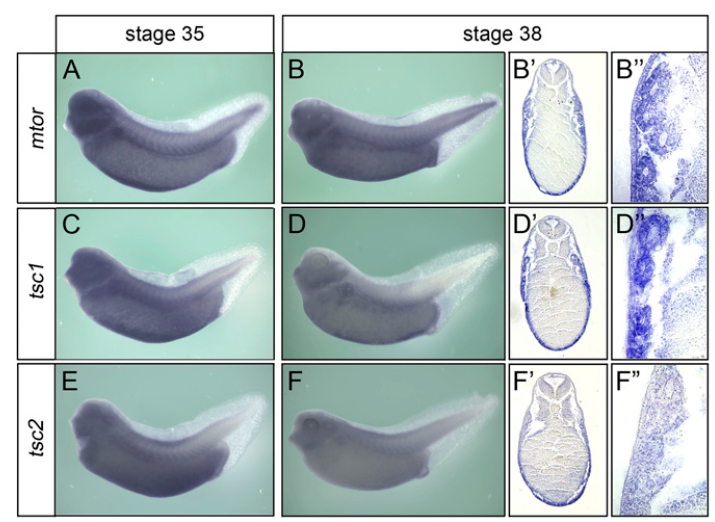
Fig. S3. Expression analysis of mechanistic target of rapamycin complex 1 (mTORC1) signaling components. Whole-mount in situ hybridizations and paraplast sections thereof comparing mtor (AâBâ²â²), tuberous sclerosis (tsc) 1 (CâDâ²â²), and tsc2 (EâFâ²â²) at stages 35 and 38. Image published in: Romaker D et al. (2014) Copyright © 2014. Image reproduced with permission of the Publisher and the copyright holder. This is an Open Access article distributed under the terms of the Creative Commons Attribution License.
Image source: Published Larger Image Printer Friendly View |
