XB-IMG-154883
Xenbase Image ID: 154883

|
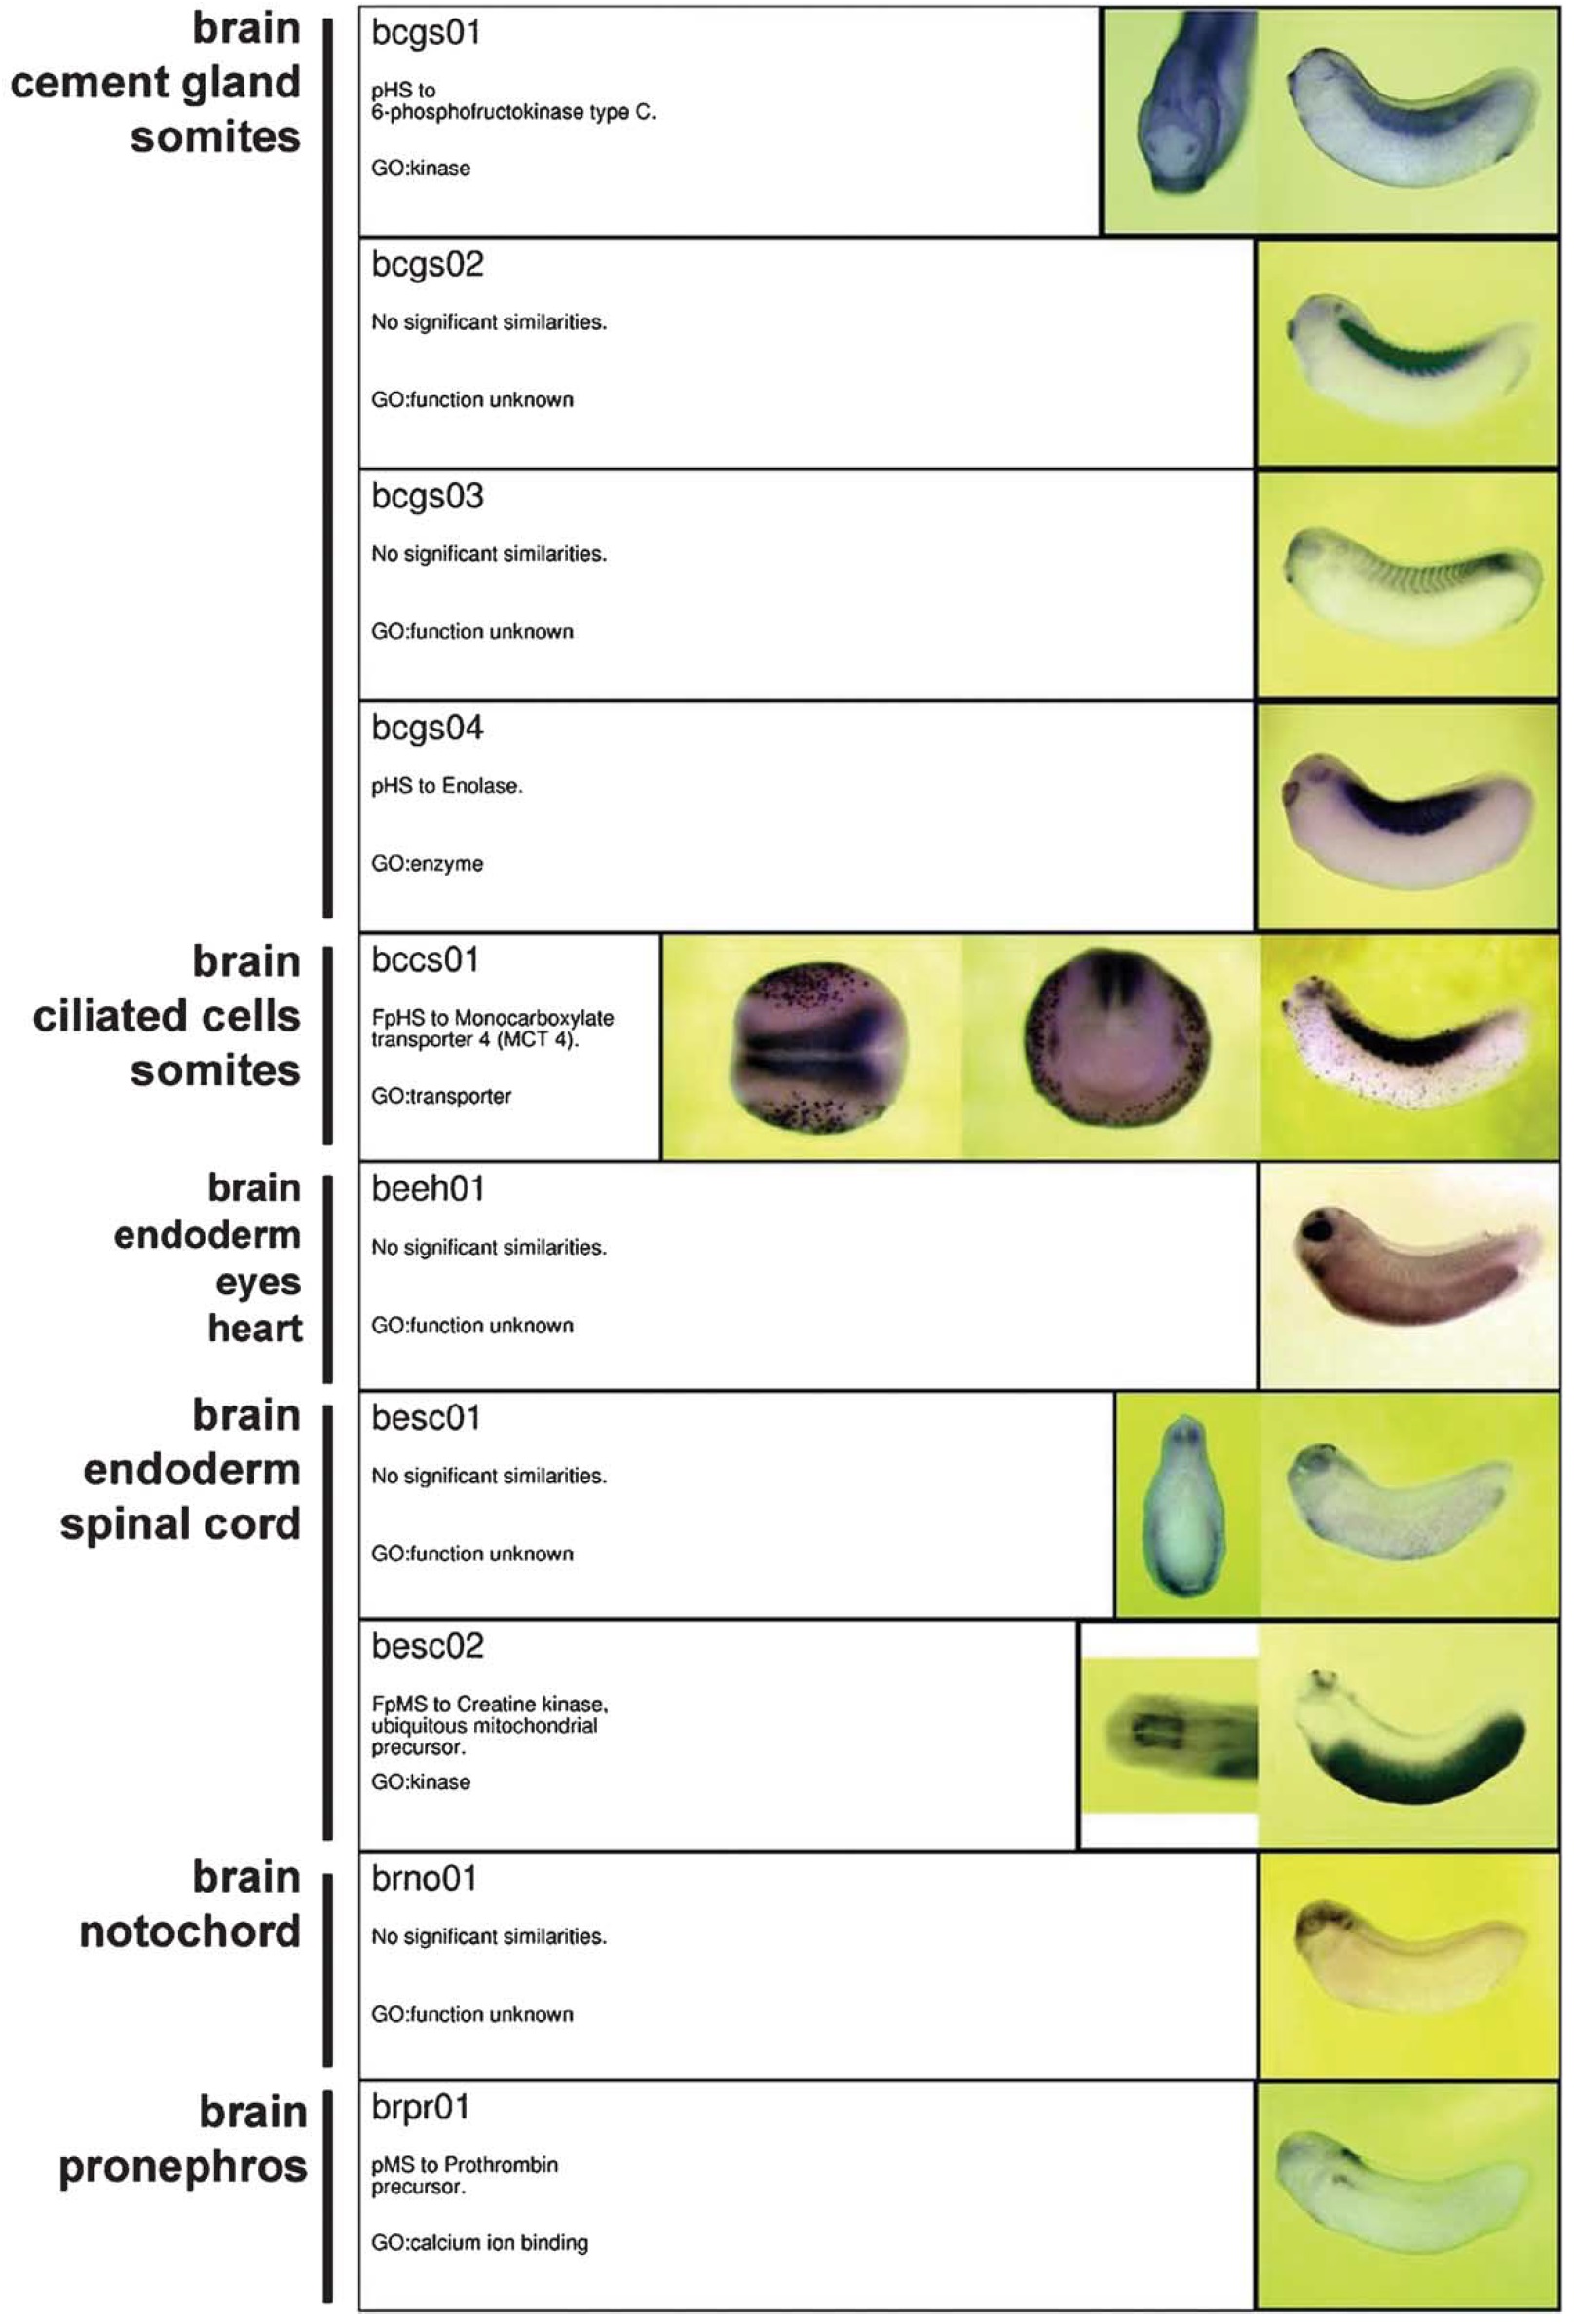
Fig. 8. (8.3) Marker genes. Whole mount in situ hybridisations of stage 10C, 13, 30 or 4 day embryos are shown. Gene symbol, sequence similarities with gene
name or description of the best hit, and GO molecular function classification are indicated. Gene order is alphabetical. The absence of pictures showing early
stages results does not necessarily imply an absence of expression, and can be ubiquitous or exceptionally not documented. The reader can find more pictures showing additional views and results from distinct experiments in Axeldb database, and a description of the expression pattern using a controlled vocabulary.
Figure panels are presented by gene expression categories in single and double column layering. The expression patterns are sorted alphabetically and
numerically, and layed out in single or double columns. An asterisk indicates the categories splitted over several page. Xl, known Xenopus gene; F, Full-Length
Open Reading Frame; A, alternative transcript; p, protein similarity; n, nucleotidic similarity; HS, high similarity; MS, medium similarity; WS, weak
similarity. Image published in: Pollet N et al. (2005) Copyright © 2005. Image reproduced with permission of the Publisher, Elsevier B. V.
Image source: Published Larger Image Printer Friendly View |
