XB-IMG-171569
Xenbase Image ID: 171569

|
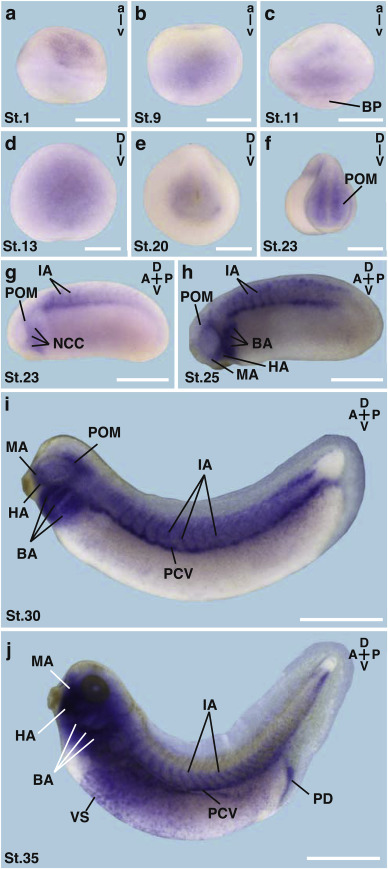
Fig. 4. Spatial expression pattern of adgra2 mRNA during Xenopus laevis embryogenesis.
Spatial expression pattern of adgra2 is visualized by WMISH. Embryonic stages are indicated in each panel. a-c. Lateral views with animal to the top. d-f. Anterior views with dorsal to the top. g-j. Lateral views with anterior to the left. f, g. The first tissue specific adgra2 expression starts at stage 23 in the periocular mesenchyme (POM), the migrating neural crest cells (NCC) and the intersomitic arteries (IA). h. At stage 25, adgra2 is expressed in the periocular mesenchyme (POM), the migrating cranial neural crest cells (NCC) and the intersomitic arteries (IA). i. At stage 30, adgra2 was detected in the branchial (BA), hyoidal (HA) and mandibular (MA) arches, the periocular mesenchyme (POM), the intersomitic arteries (IA) and the posterior cardinal vein (PCV). j. At stage 35 adrga2 transcripts were detected in the pharyngeal arches (BA, HA and MA), in the intersomitic arteries (IA), the vascular system (VS), the posterior cardinal vein (PCV) and the proctodeum (PD). a, animal; A, anterior; BA, branchial arches; BP, blastoporus; D, dorsal; HA, hyoidal arch; IA, intersomitic arteries; MA, mandibular arch; NCC, neural crest cells; P, posterior; PCV, posterior cardinal vein; PD, proctodeum; POM, periocular mesenchyme; v, vegetal; V, ventral. Scale bars: 500â¯Î¼m (aâh): 1â¯mm (i, j). Image published in: Seigfried FA et al. (2018) Copyright © 2018. Image reproduced with permission of the Publisher, Elsevier B. V.
Image source: Published Larger Image Printer Friendly View |
