XB-IMG-172558
Xenbase Image ID: 172558
|
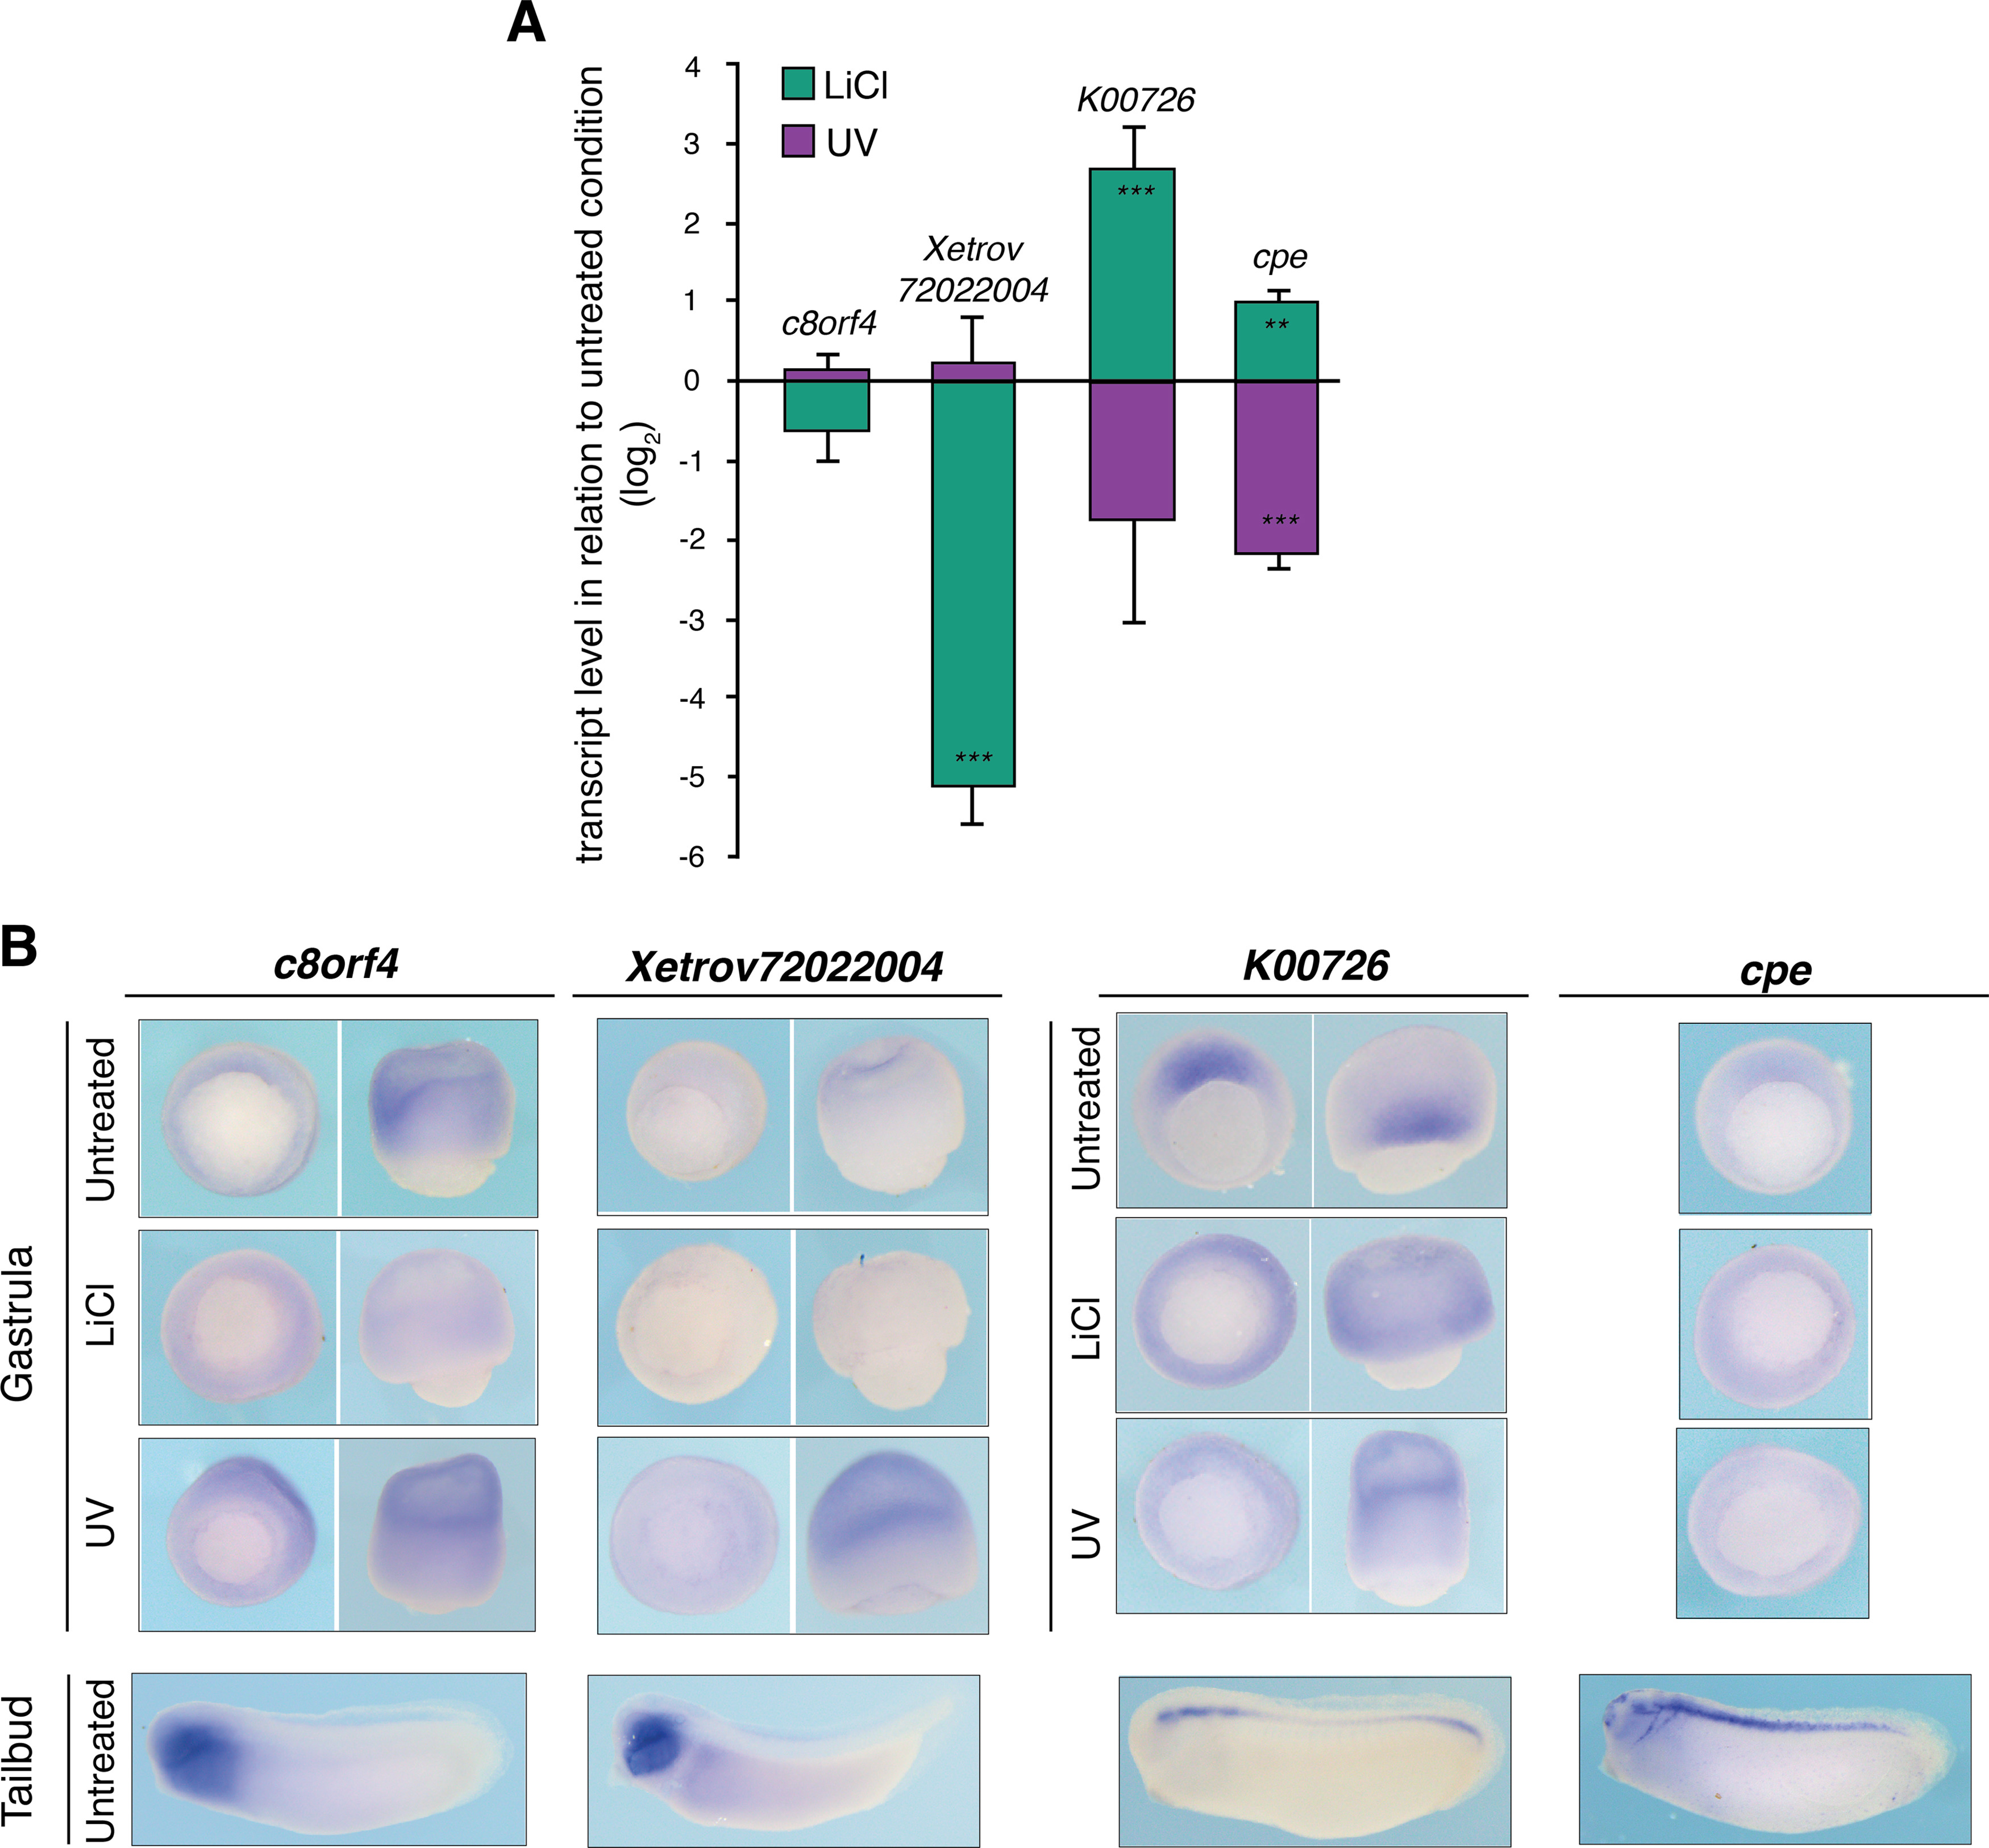
Fig. 6.
Expression analysis of uncharacterised genes identified by the means of nongenetic axis perturbation and comparative transcriptomics. RT-qPCR (A) and WMISH (B) of c8orf4, Xetrov72022004, K00726 and cpe. (A) Error bars, SEM of biological triplicates. Student's two-tailed t-test: *, pâ<â0.1; **, pâ<â0.05; and ***, pâ<â0.01. (B) Mid-gastrula stages, vegetal and lateral view except for cpe with vegetal view only; and mid-tailbud stage, lateral view. Image published in: Monteiro RS et al. (2018) © 2018 The Authors. Creative Commons Attribution license
Image source: Published Larger Image Printer Friendly View |