XB-IMG-44894
Xenbase Image ID: 44894

|
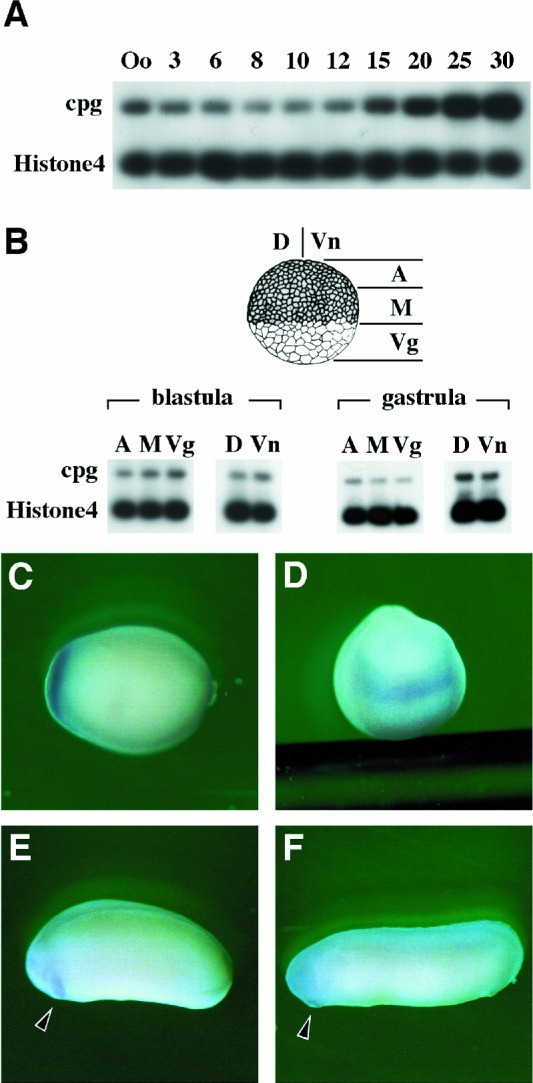
Figure 2. Temporal and spatial expression of cpg during Xenopus development. A: Quantitative reverse transcriptase polymerase chain reaction (RT-PCR) was performed by using 1 mu g of total RNA extracted from Xenopus embryos at different stages. Oo indicates the oocyte stage and numbers indicate the developmental stages. Maternal transcripts decreased gradually until the mid-blastula stage (st. 8), and zygotic expression increased after the initial gastrula stage (st. 10). B: Quantitative RT-PCR to determine spatial expression was performed by using total RNA extracted from different dissections of embryos at the mid-blastula stage (st. 8) and the initial gastrula stage (st. 10). cpg was expressed ubiquitously during these stages. C-F: Localization of cpg transcripts in Xenopus embryos after the neurula stage by whole-mount in situ hybridization. At the neurula stage (st. 16), cpg was expressed in the cement gland precursor region in C (ventral view) and D (anterior view). After the tailbud stage, cpg was expressed in the anterior region especially in the cement gland (arrowheads) in E (st. 25) and F (st. 30). Image published in: Goto T et al. (2001) Copyright © 2001. Image reproduced with permission of the Publisher, John Wiley & Sons.
Image source: Published Larger Image Printer Friendly View |
