XB-IMG-49535
Xenbase Image ID: 49535

|
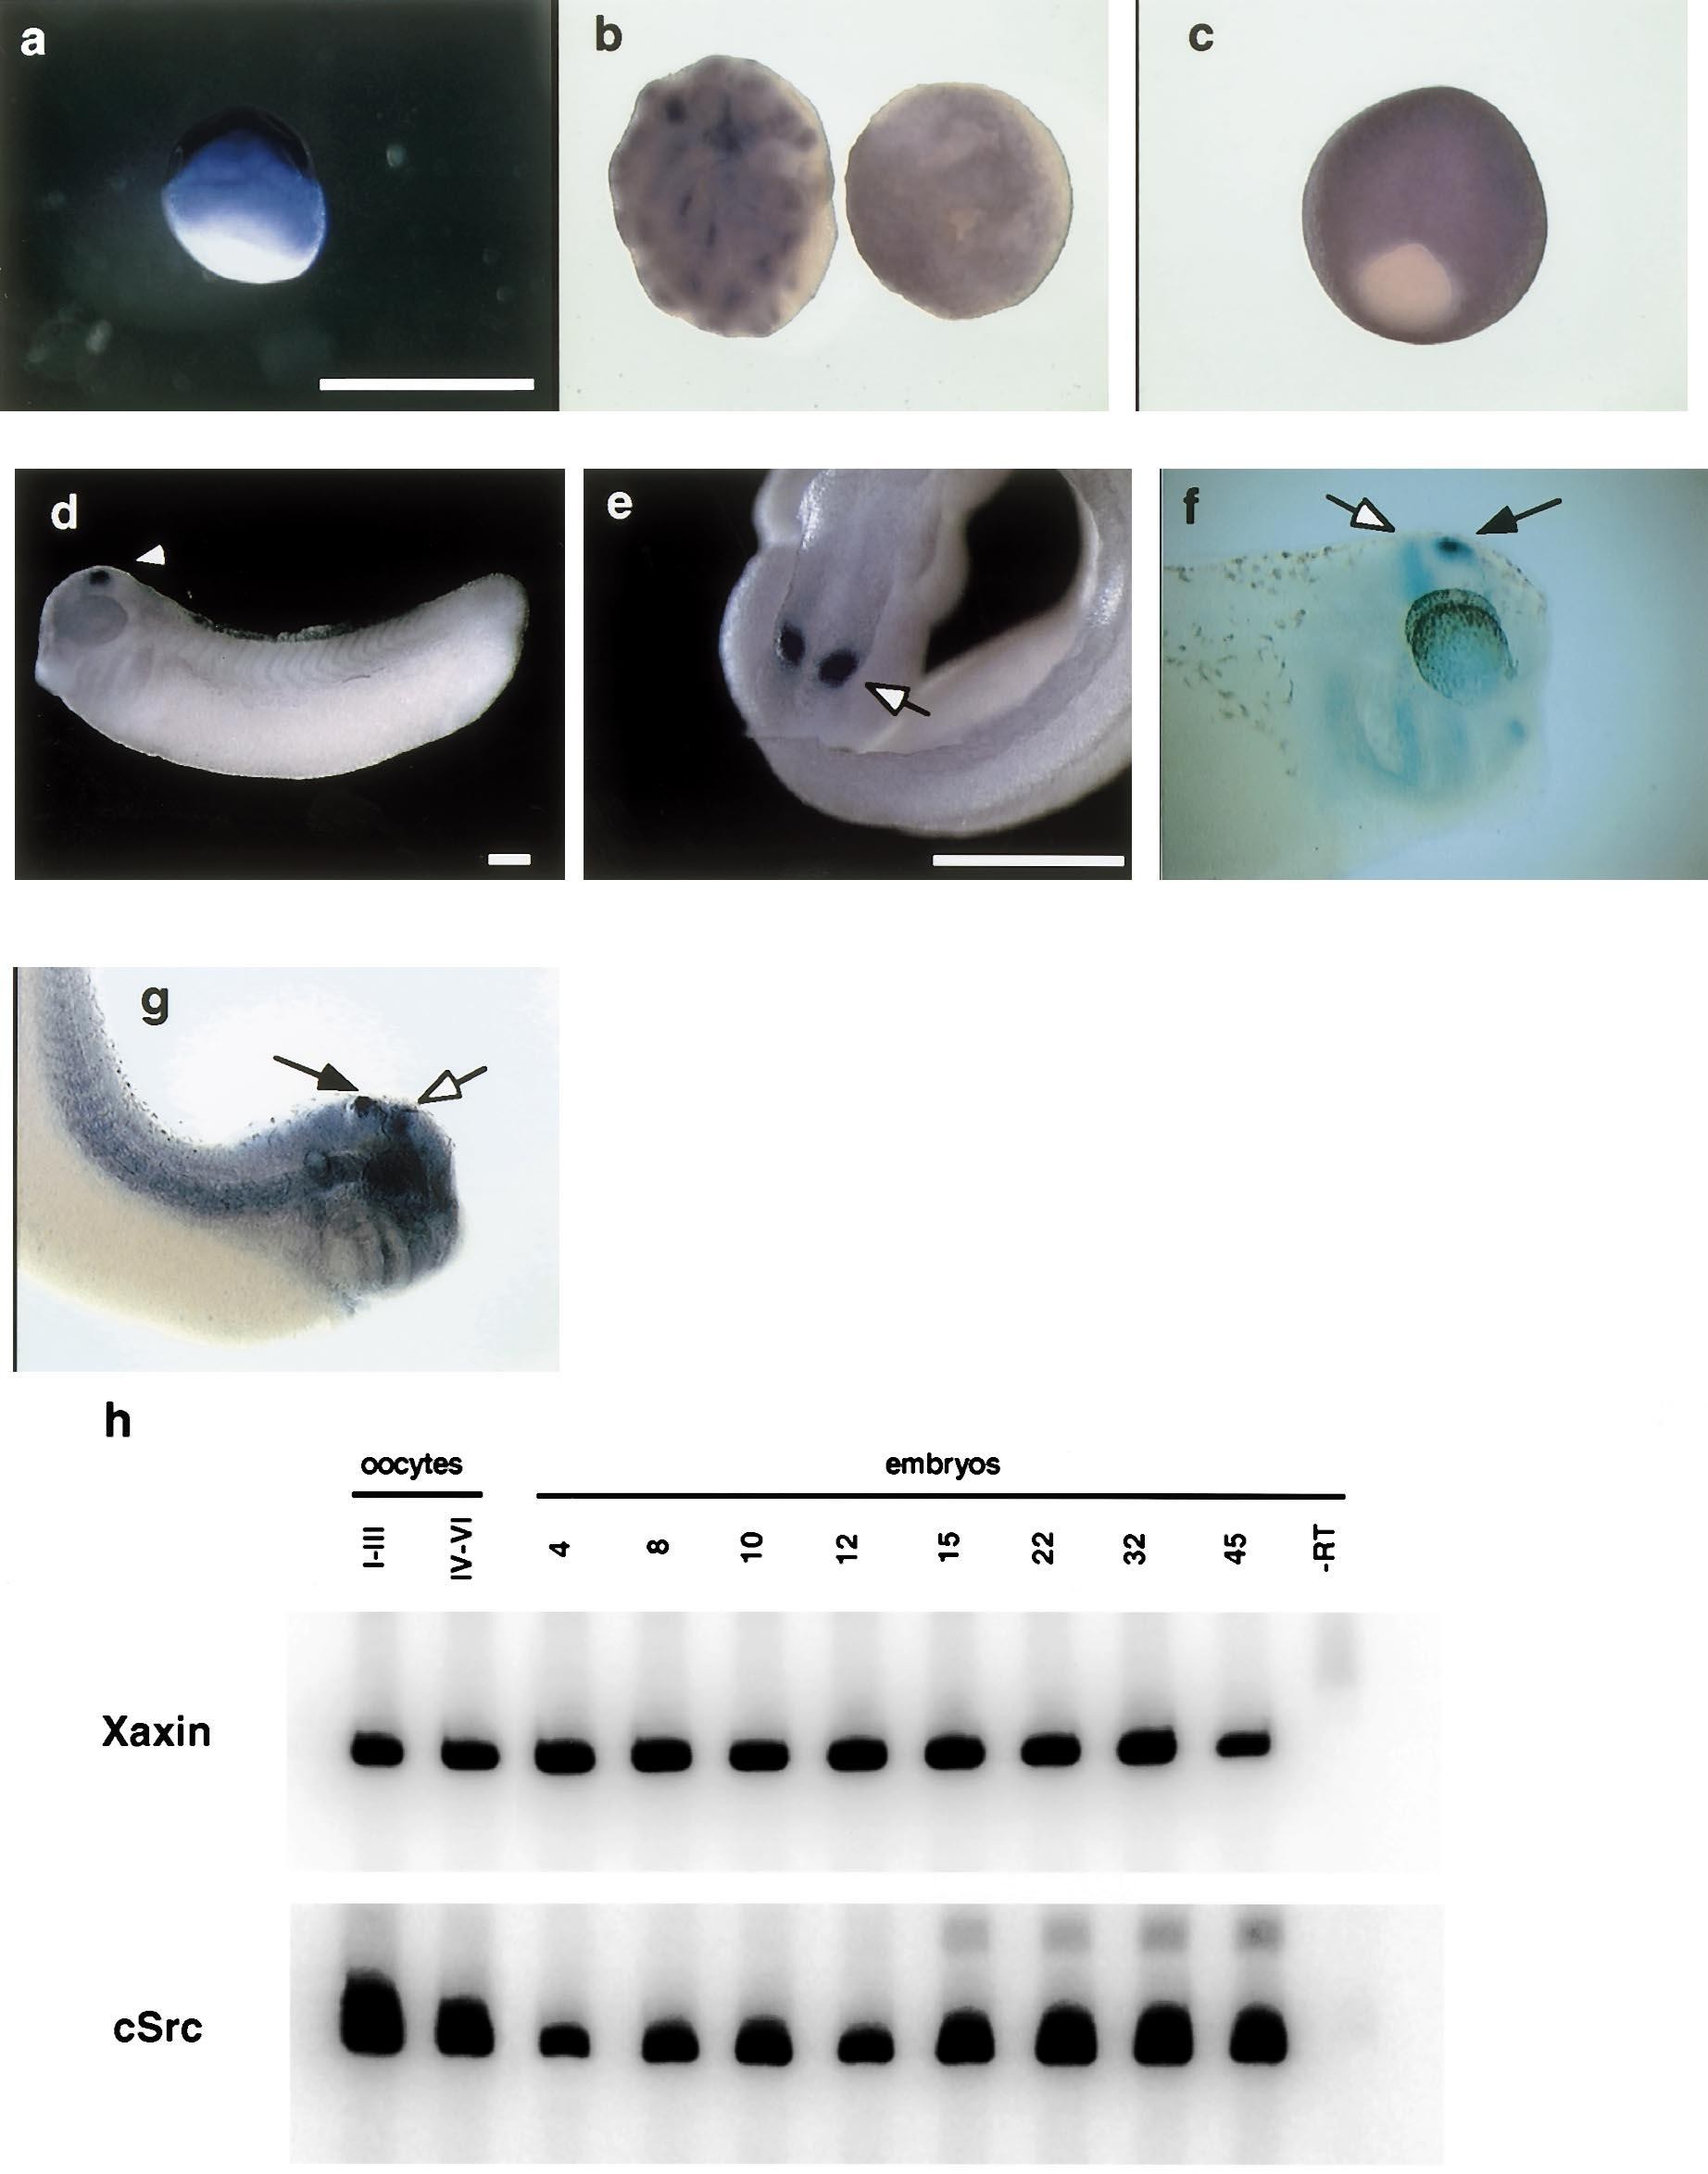
Fig. 2. Expression pattern of Xaxin. (A) Whole mount in situ hybridization in Stage II oocytes. (B) Sixty-four cell and blastula stage embryos. (C) Gastrula
stage embryo. (D) Tailbud stage, lateral view (during late neurula, a band is first observed in the neural plate. This staining becomes more intense and
localizes to the anterior midbrain, adjacent to the forebrainidbrain boundary by the tailbud stage). (E) Dorsal view of tailbud embryo. Scale bar, 0.5 mm, in
each figure. (F) Double in situ hybridization with Xaxin (black arrow) and engrailed (open arrow) in stage 32 embryo. (G) Double in-situ hybridization with
Xaxin (black arrow) and Xwnt-2B (open arrow). (H) Whole oocytes and embryos were subjected to RT-PCR analysis to determine the temporal expression
pattern of Axin. c-Src is used as a loading control (lower panel). Stages are indicated at the top. A negative control without reverse transcriptase is indicated
in the right lane (-RT). Image published in: Hedgepeth CM et al. (1999) Copyright © 1999. Image reproduced with permission of the Publisher, Elsevier B. V.
Image source: Published Larger Image Printer Friendly View |
