XB-IMG-74767
Xenbase Image ID: 74767

|
|||||||||||||||||||||||||||||||||||
|
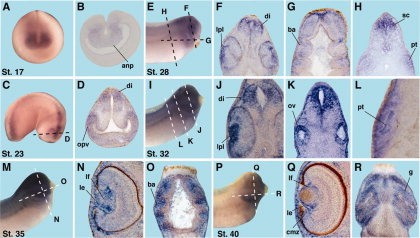
Figure 3. Horizontal and transversal section analyses of the IRS-1 expression pattern. anp, anterior neural plate; ba, branchial arches; cmz, ciliary marginal zone; di, diencephalon; g, gill; le, lens epithelium; lf, lens fibers; lpl: lens placode; opv, optic vesicle; ov, otic vesicle; pt, proximal tubule of pronephros; sc, spinal cord.Download figure to PowerPoint Image published in: Bugner V et al. (2011) Copyright © 2011. Image reproduced with permission of the Publisher, John Wiley & Sons.
Image source: Published Larger Image Printer Friendly View |
