XB-IMG-77266
Xenbase Image ID: 77266

|
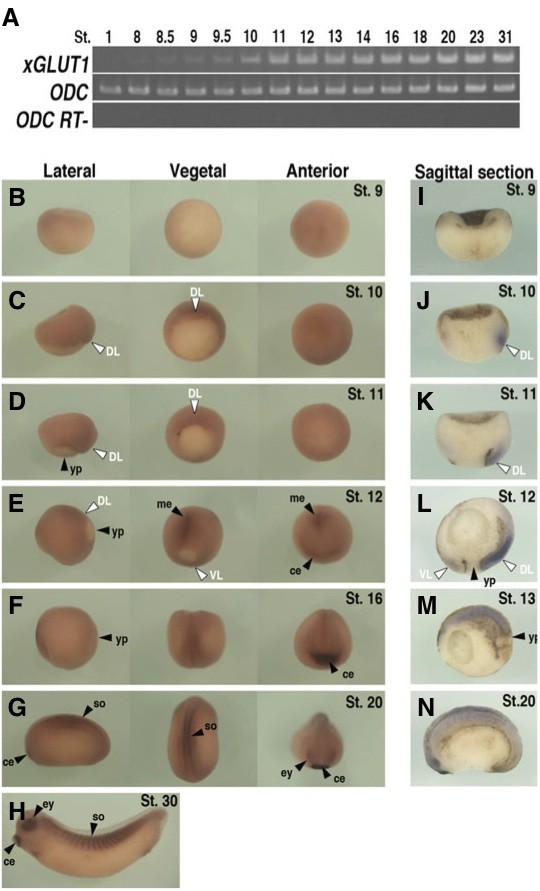
Fig. 2. Expression patterns of xGLUT1. (A) Temporal expression of xGLUT1 was analyzed by RT-PCR. xGLUT1 expression was not detected maternally. At the blastula stage, low levels of xGLUT1 expression were detected. Expression levels increased at stage 9.5, with high levels of expression being maintained by stage 31. Spatial patterns of xGLUT1 expression were analyzed by in situ hybridization. (B-N) Spatial expression patterns of xGLUT1 analyzed by whole mount in situ hybridization. (B-H) Outer view of albino embryos. Left column, lateral view; middle column, vegetal view; right column, anterior view. (I-N) Sagittal sections of wild-type embryos. Signal was detected as blue staining. (C,D,J,K) From late blastula stage, xGLUT1 mRNA expression was seen in the mesodermal region, especially in the dorsal lip (DL, white arrowhead). (E,L) At the late gastrula, xGLUT1 expression was extended to the ventral lip (VL, white arrowhead). (M) At stage 13, ventral expression had disappeared, but intense expression was maintained in the deeply involuted dorsal-mesodermal region. (F-H, N) From the neurula stage, expression was detected mainly in the cement gland, eye fields and somite. DL, dorsal lip; VL, ventral lip; yp, yolk plug; me, mesoderm; ce, cement gland; so, somite; ey, eye field. Image published in: Suzawa K et al. (2007) Copyright © 2007. Image reproduced with permission of the Publisher.
Image source: Published Larger Image Printer Friendly View |
