XB-IMG-82591
Xenbase Image ID: 82591
|
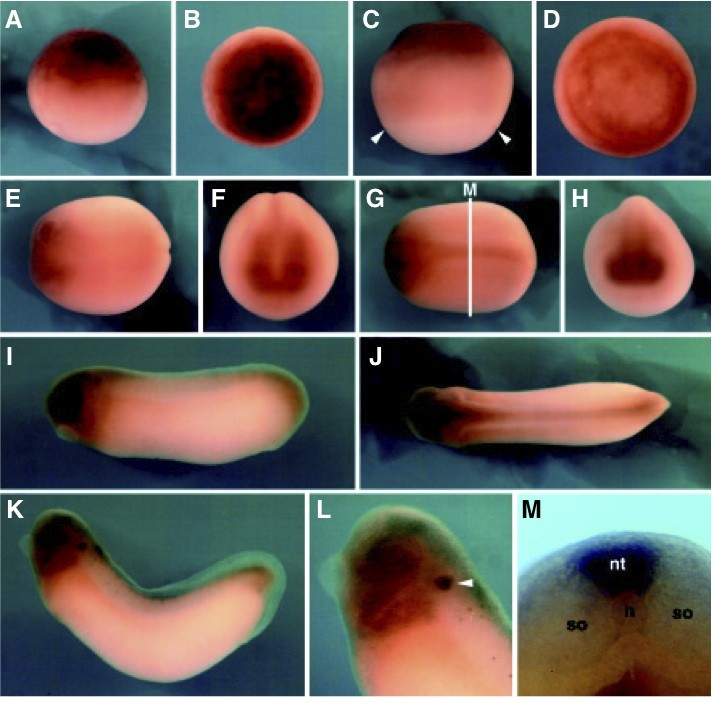
Fig. 4. The spatial expression of XMam1 analyzed by whole-mount in situ hybridization. The staining in brown shows XMam1 expression. (A) Blastula (st. 7). Lateral view. XMam1 is expressed in the animal hemisphere. (B) Animal view of (A). (C) Mid-gastrula (st. 11). Lateral view. The expression of XMam1 was more intense in the animal half than in the vegetal half. Arrow indicates blastopore. (D) Animal view of (C). (E) Mid-neurula (st. 15). Dorsal view. XMam1 is expressed in the anterior side of embryos. (F) Anterior view of (E). XMam1 mRNA was observed at the anterior side of the neural plate. (G) Late neurula (st. 20). Dorsal view. As in mid-neurula, transcripts of XMam1 were detected at the anterior side. A weak XMam1 mRNA signal was observed in the neural tube. White line indicates the plane of section of panel (M). (H) Anterior view of (G). In comparison to expression in st. 15 embryos, the XMam1-expressing region was somewhat narrower. (I) st. 25 embryo. Lateral view. Strong expression of XMam1 was observed in the eye, in addition to the head regions. (J) Dorsal view of (I). (K) Tailbud-stage embryo (st. 35). Lateral view. XMam1 expression was observed in the entire region of head. The intensity of XMam1 transcripts observed at st. 25 was reduced at this stage. (L) Magnification of the head in (K). XMam1 was strongly expressed in the otic vesicle (arrowhead). (M) Transverse section of embryo shown in (G). XMam1 was expressed in the neural tube. nt, neural tube; n, notochord; so, somite. Image published in: Katada T and Kinoshita T (2003) Copyright © 2003. Image reproduced with permission of the Publisher, University of the Basque Country Press.
Image source: Published Larger Image Printer Friendly View |