Xenbase v4.4
Xenbase launched 4 new features (June 2017, Xenbase v 4.4).
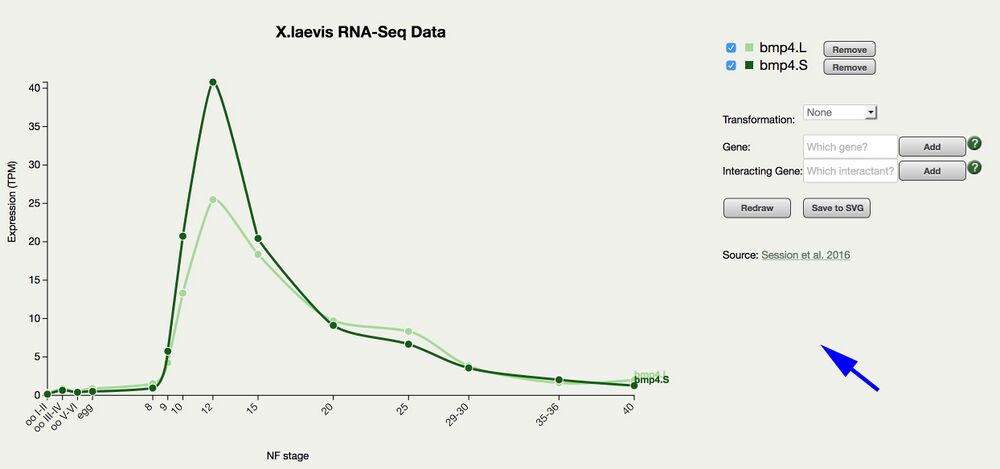
1. NEW Interactive RNA-seq temporal expression graphs.
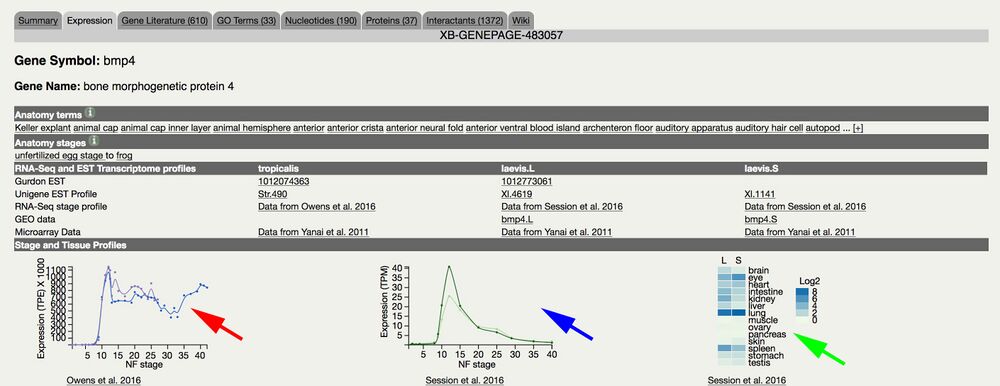
Access via Gene Page/Expression tab. Example: bmp4
Links from Expression menu and homepage tiles & Tool to add/map gene lists coming soon
Click the thumbnail graph to open.
Use dialogue boxes to add additional genes.
Graphs can be saved in svg format.
Expression values plotted as either raw or log2.
Mouse over a data point to display the value/stage

Incorporages expression data from X. tropicalis expression data, Cell Reports, Owens et al. (2016)
Graphs transcripts per embryo values vs. developmental stages: NF stage 1-42.

Incorporates expression data from X. laevis genome paper in Nature, Session et. al. (2016)
Graphs transcripts per million (TPM) values vs. developmental stages: oocyte, egg stages, and NF stage 8-40.
Plots X. laevis L and S homeologs.

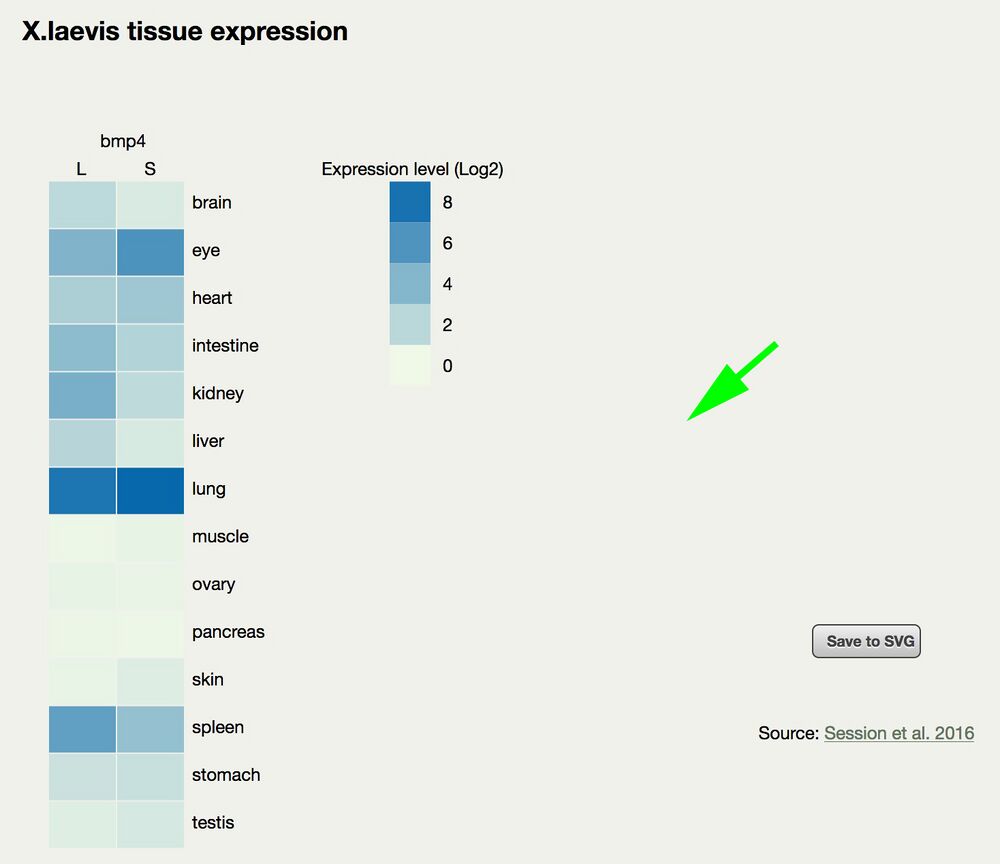
Adult laevis heat map tissue expression display comparing L and S homeologs.

2. View the latest ‘Xenopus Research Articles’
Top right hand corner of above Announcements.
Updated weekly
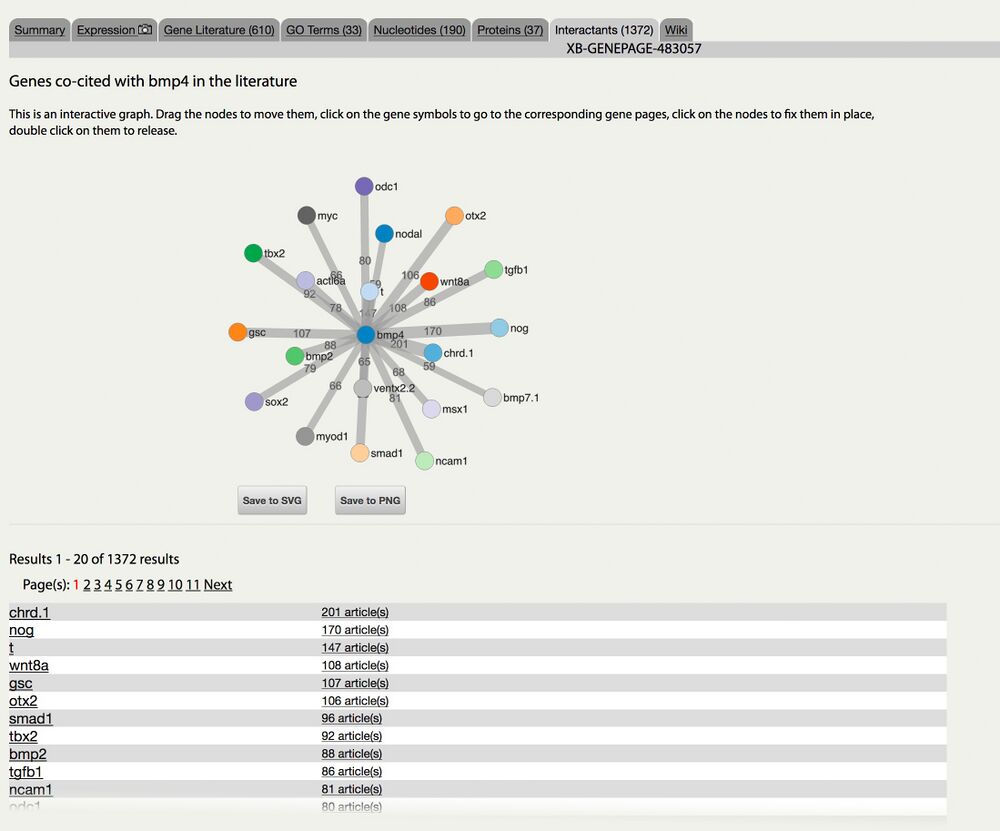
3. NEW Interactive gene-interaction visualization.
Access via Gene Page Summary or Interactants tab - e.g., bmp4

Interaction is determined based on co-citation in research articles.
Graph can be saved in png and svg format.
Graph shows top 20 genes: scroll to show next 20
Number on edges indicate number of co-citations.
Click to move a gene/node, double click to release it.

4. Xenopus Article Page, now includes a list of references cited in the paper (when available).
Use the [+] [-] to toggle list. * Links to PubMed and Xenbase Article Pages.
e.g., Wagner et al PLoS Genet. May 1, 2017; 13 (5): e1006757.
